Be honest: do you actually know which of your branches make money?

More importantly, do you know how they make it? And how they lose it?

Which products drive the most profit? Which customers spend the most? Where you're quietly bleeding money through overstaffing, wasted ads, or inefficient inventory?

Successful owners we work with not only obsess on selling more, but also on losing less.

Payroll eats your margins. Ads deliver clicks, not paying customers. Reports show up weeks late, long after you could've done anything about it.
That's why growth feels like rolling dice. Some branches pay off. Others drain tens of thousands a month. You don't find out until it's too late (or worse never at all).

This is how we took one clinic business from 12 to 60 locations, using nothing but better data. The playbook works the same for retail, restaurants, and any multi-location business. What follows is the exact framework they use to turn struggling branches into profit machines.

By: Competence Analytics LLC

The Growth Plateau:

Busy Doesn’t Mean Profitable

When we first stepped in, the business had 12 clinics across the region. On paper, things looked decent. Revenue was steady. New customers were walking in. Costs looked “manageable.”

But underneath? Chaos.
Staff performance was invisible

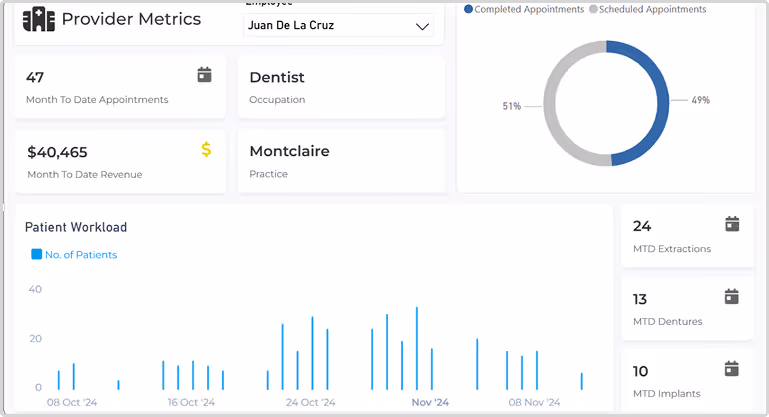
In clinics, that meant doctors. In retail, it could be sales reps. In restaurants, waitstaff or kitchen teams. The best performers carried the business, but leadership had no idea who they were.

“Busy” locations bled money

A store packed with customers looked like a success… until you factored in rent, overstaffing, and wasted stock.

Marketing was blind

Ads drove clicks, traffic, and sign-ups. But nobody knew which campaigns led to actual profit.

Decisions were gut feel

Schedules, where to cut costs, even Expansions... all based on instinct, not evidence.

The result?

Growth stalled. Leaders wanted to scale, but every move felt like
a risk they couldn’t measure.

How We Turned “Data Chaos” Into a Clear Picture

The turning point came when leadership admitted: flying blind isn’t an option anymore.

The fix wasn’t adding new tools.
It was finally connecting the ones they already had:

Sales data from POS or booking systems
Payroll and HR data showing labor costs and schedules
Accounting and finance data with the real margins
Marketing data from ads, loyalty, and campaigns
Customer data showing who came back and why
Before:

Five Excel files bouncing between dozens of managers and staff. Everyone has their own version. Formulas break. Numbers don’t match. Reports arrive days late and still don’t tell you the whole story. By the time they realize something’s wrong, Money is already lost.


Using the same cloud technology that is affordable,scalable and trusted by the world’s biggest companies

We connected all the data from their scattered systems into one place
The result?

A live dashboard that updates automatically every day with 99% accuracy. Sales, payroll, marketing, and costs finally talk to each other. All the insights in one place, eliminating the need to chase spreadsheets or second-guesses.

Questions like “Which branch bleeds profit?” or “Which ads actually work?” get answered in seconds, not weeks.

Why Combining Data Changes Everything

Looking at one system in isolation paints an incomplete picture:

Sales alone:
shows revenue, but not profit
Marketing alone shows clicks, not paying customers
Accounting alone shows totals, but not which branch or product makes money.
Payroll alone
shows cost, but not if staff are actually productive.

The gold comes from overlap:

Sales + Accounting:
Reveals which products actually make money
Sales + Marketing:
Proves which campaigns create profitable customers
Sales + Payroll:
Shows revenue per labor hour. Who’s a star and who drags you down
Sales + Inventory: Flags stock that moves vs. stock that dies on shelves
Sales + Customer Management:
Spots loyal customers,
why they buy, and how to keep them
Alone, each system is a clue.
Together, they tell the whole story
Stop guessing. Start knowing. See what your data’s
been hiding in a 30-minute Free Audit
What We Found Under the Hood
The truth hit hard:
Staff performance:
A handful of providers carried the business. Others were underperforming, hidden in averages.
Branch profitability:
The busiest branches weren’t the most profitable. High rent and bloated payroll quietly erased margins. A smaller “quiet” branch was actually performing better.
Marketing ROI:
Ads drove clicks and traffic... to branches already drowning. Marketing dollars were literally paying to turn customers away.
Scheduling:
Staff were stacked on slow mornings and thin on busy afternoons. Payroll was leaking tens of thousands every month to inefficient staffing.
These weren’t guesses anymore.
The numbers were right there on the screen.
Scaling Without Fear

With real visibility, expansion stopped being guesswork:

New locations were modeled after the proven profitable ones
Marketing spend shifted to campaigns that paid off in profit, not clicks
Underperformers were coached or reassigned, raising the bar across the board
Expansion decisions came with confidence instead of sleepless nights
The result?
12 locations became 60.
And the same method worked in retail and restaurants too. replicate the winners, fix or close the losers.
Small Wins That Stack Into Millions

You don’t need to triple your size to feel the impact. Even tiny tweaks created big results:

 Moving ad spend away from ineffective campaigns saved $15k in one quarter
Adjusting staff schedules cut labor costs by 12%, no layoff
Reassigning one underperforming provider boosted margins by $8k a month

Stack these wins across multiple branches, and hundreds of thousands in annual savings become millions as you scale.
What This Means for You
You don't need a billion-dollar firm behind you. Whether you've got 3 stores, 10 restaurants, or 20 service branches, your data already knows the truth.
The question is: are you using it?
Do you know which branches are profitable after costs?
Can you spot your star staff, and your underperformers?
Are your ads creating paying customers or burning cash?
Are you scheduling based on facts or gut feel?
If the answer is
“I don’t know,”
you’re gambling.
Every Month You Wait, You Lose
Scaling from 12 to 60 wasn’t luck.
It was clarity.

Connecting Data didn’t just save money.
It gave confidence, confidence to invest, to expand, to cut losses, and to double down on winners.
Here’s the cost of inaction: every month you rely on spreadsheets and hunches, you bleed money to wasted payroll, unprofitable ads, and “busy” branches that quietly lose.

Stop gambling with your best branches

Copy the DNA of your winners. Fix or close the losers.
Stop guessing. Start knowing. See what your data’s been hiding in a 30-minute Free Audit
Button Text